前置条件
kind集群搭建
knatieve-cli安装
Installing the Knative CLI - Knative
CRD & controller Install
serving
Install Serving with YAML - Knative
eventing
Install Eventing with YAML - Knative
Serving
创建一个knative service
apiVersion: serving.knative.dev/v1
kind: Service
metadata:
  name: echo-server
spec:
  template:
    spec:
      containers:
        - image: ghcr.io/knative/helloworld-go:latest
          ports:
            - containerPort: 8080
          env:
            - name: TARGET
              value: "World"
由于没有external-ip,我们直接port-forward istio的gateway流量到本地8080端口
k port-forward svc/istio-ingressgateway -n istio-system 8080:80请求看看
curl -H "Host: echo-server.default.example.com" http://localhost:8080
Hello World!
Traffic splitting
knative 基于底层网络(这里我们选择istio)实现了流量的细粒度转发
修改原本yaml为:
apiVersion: serving.knative.dev/v1
kind: Service
metadata:
  name: echo-server
spec:
  template:
    spec:
      containers:
        - image: ghcr.io/knative/helloworld-go:latest
          ports:
            - containerPort: 8080
          env:
            - name: TARGET
              value: "Knative"
  traffic:
  - latestRevision: true
    percent: 50
  - latestRevision: false
    percent: 50
    revisionName: echo-server-00001
查看revision
k get revisions.serving.knative.dev
NAME                CONFIG NAME   GENERATION   READY   REASON   ACTUAL REPLICAS   DESIRED REPLICAS
hello-world-00001   hello-world   1            True             1                 1
hello-world-00002   hello-world   2            True             1                 1
可以再请求看看,流量确实是 各自百分之50的切分
autoScaling相关的配置
apiVersion: serving.knative.dev/v1
kind: Service
metadata:
  name: demo-autoscale-app
  namespace: default
spec:
  template:
    metadata:
      annotations:
        # 1. Autoscaler 类型(默认 KPA,可不写)
        autoscaling.knative.dev/class: kpa.autoscaling.knative.dev

        # 2. 指标类型(并发 or RPS);如果使用 RPS 改成 "rps"
        autoscaling.knative.dev/metric: "concurrency"

        # 3. 每个 Pod 目标负载
        autoscaling.knative.dev/target: "20"

        # 4. 预热比例(70% 意味着 14 就开始扩容)
        autoscaling.knative.dev/target-utilization-percentage: "70"

        # 5. Scale to Zero 下限
        autoscaling.knative.dev/min-scale: "0"

        # 6. 最大副本数
        autoscaling.knative.dev/max-scale: "10"

        # 7. 首次部署副本数
        autoscaling.knative.dev/initial-scale: "2"

        # 8. 冷启动激活时最少 Pod 数
        autoscaling.knative.dev/activation-scale: "2"

        # 9. 缩容延迟
        autoscaling.knative.dev/scale-down-delay: "60s"

        # 10. 稳态窗口
        autoscaling.knative.dev/window: "30s"
    spec:
      # 11. 容器级最大并发(硬限制)
      containerConcurrency: 50
      containers:
        - image: ghcr.io/knative/helloworld-go:latest
          ports:
            - containerPort: 8080
Scaling 效果体验
为了让scaling 的能力更好的体现,可以调整service参数设置,来降低扩缩容门槛
Autoscale Sample App - Go - Knative
apiVersion: serving.knative.dev/v1
kind: Service
metadata:
  name: scaling-demo
  namespace: default
spec:
  template:
    metadata:
      annotations:
        # 使用 KPA(默认,响应快)
        autoscaling.knative.dev/class: kpa.autoscaling.knative.dev

        # 基于并发扩容
        autoscaling.knative.dev/metric: "concurrency"
        autoscaling.knative.dev/target: "2"
        autoscaling.knative.dev/target-utilization-percentage: "50"

        # 扩缩容范围
        autoscaling.knative.dev/min-scale: "0"      # 生产建议至少 1 个
        autoscaling.knative.dev/max-scale: "10"
        autoscaling.knative.dev/initial-scale: "1"

        # 时间控制
        autoscaling.knative.dev/scale-down-delay: "30s"
        autoscaling.knative.dev/window: "60s"
    spec:
      containerConcurrency: 20                    # 硬限制提高到 100
      containers:
      - image: ghcr.io/knative/helloworld-go:latest
        env:
        - name: TARGET
          value: "Go Sample v1"
        ports:
        - containerPort: 8080
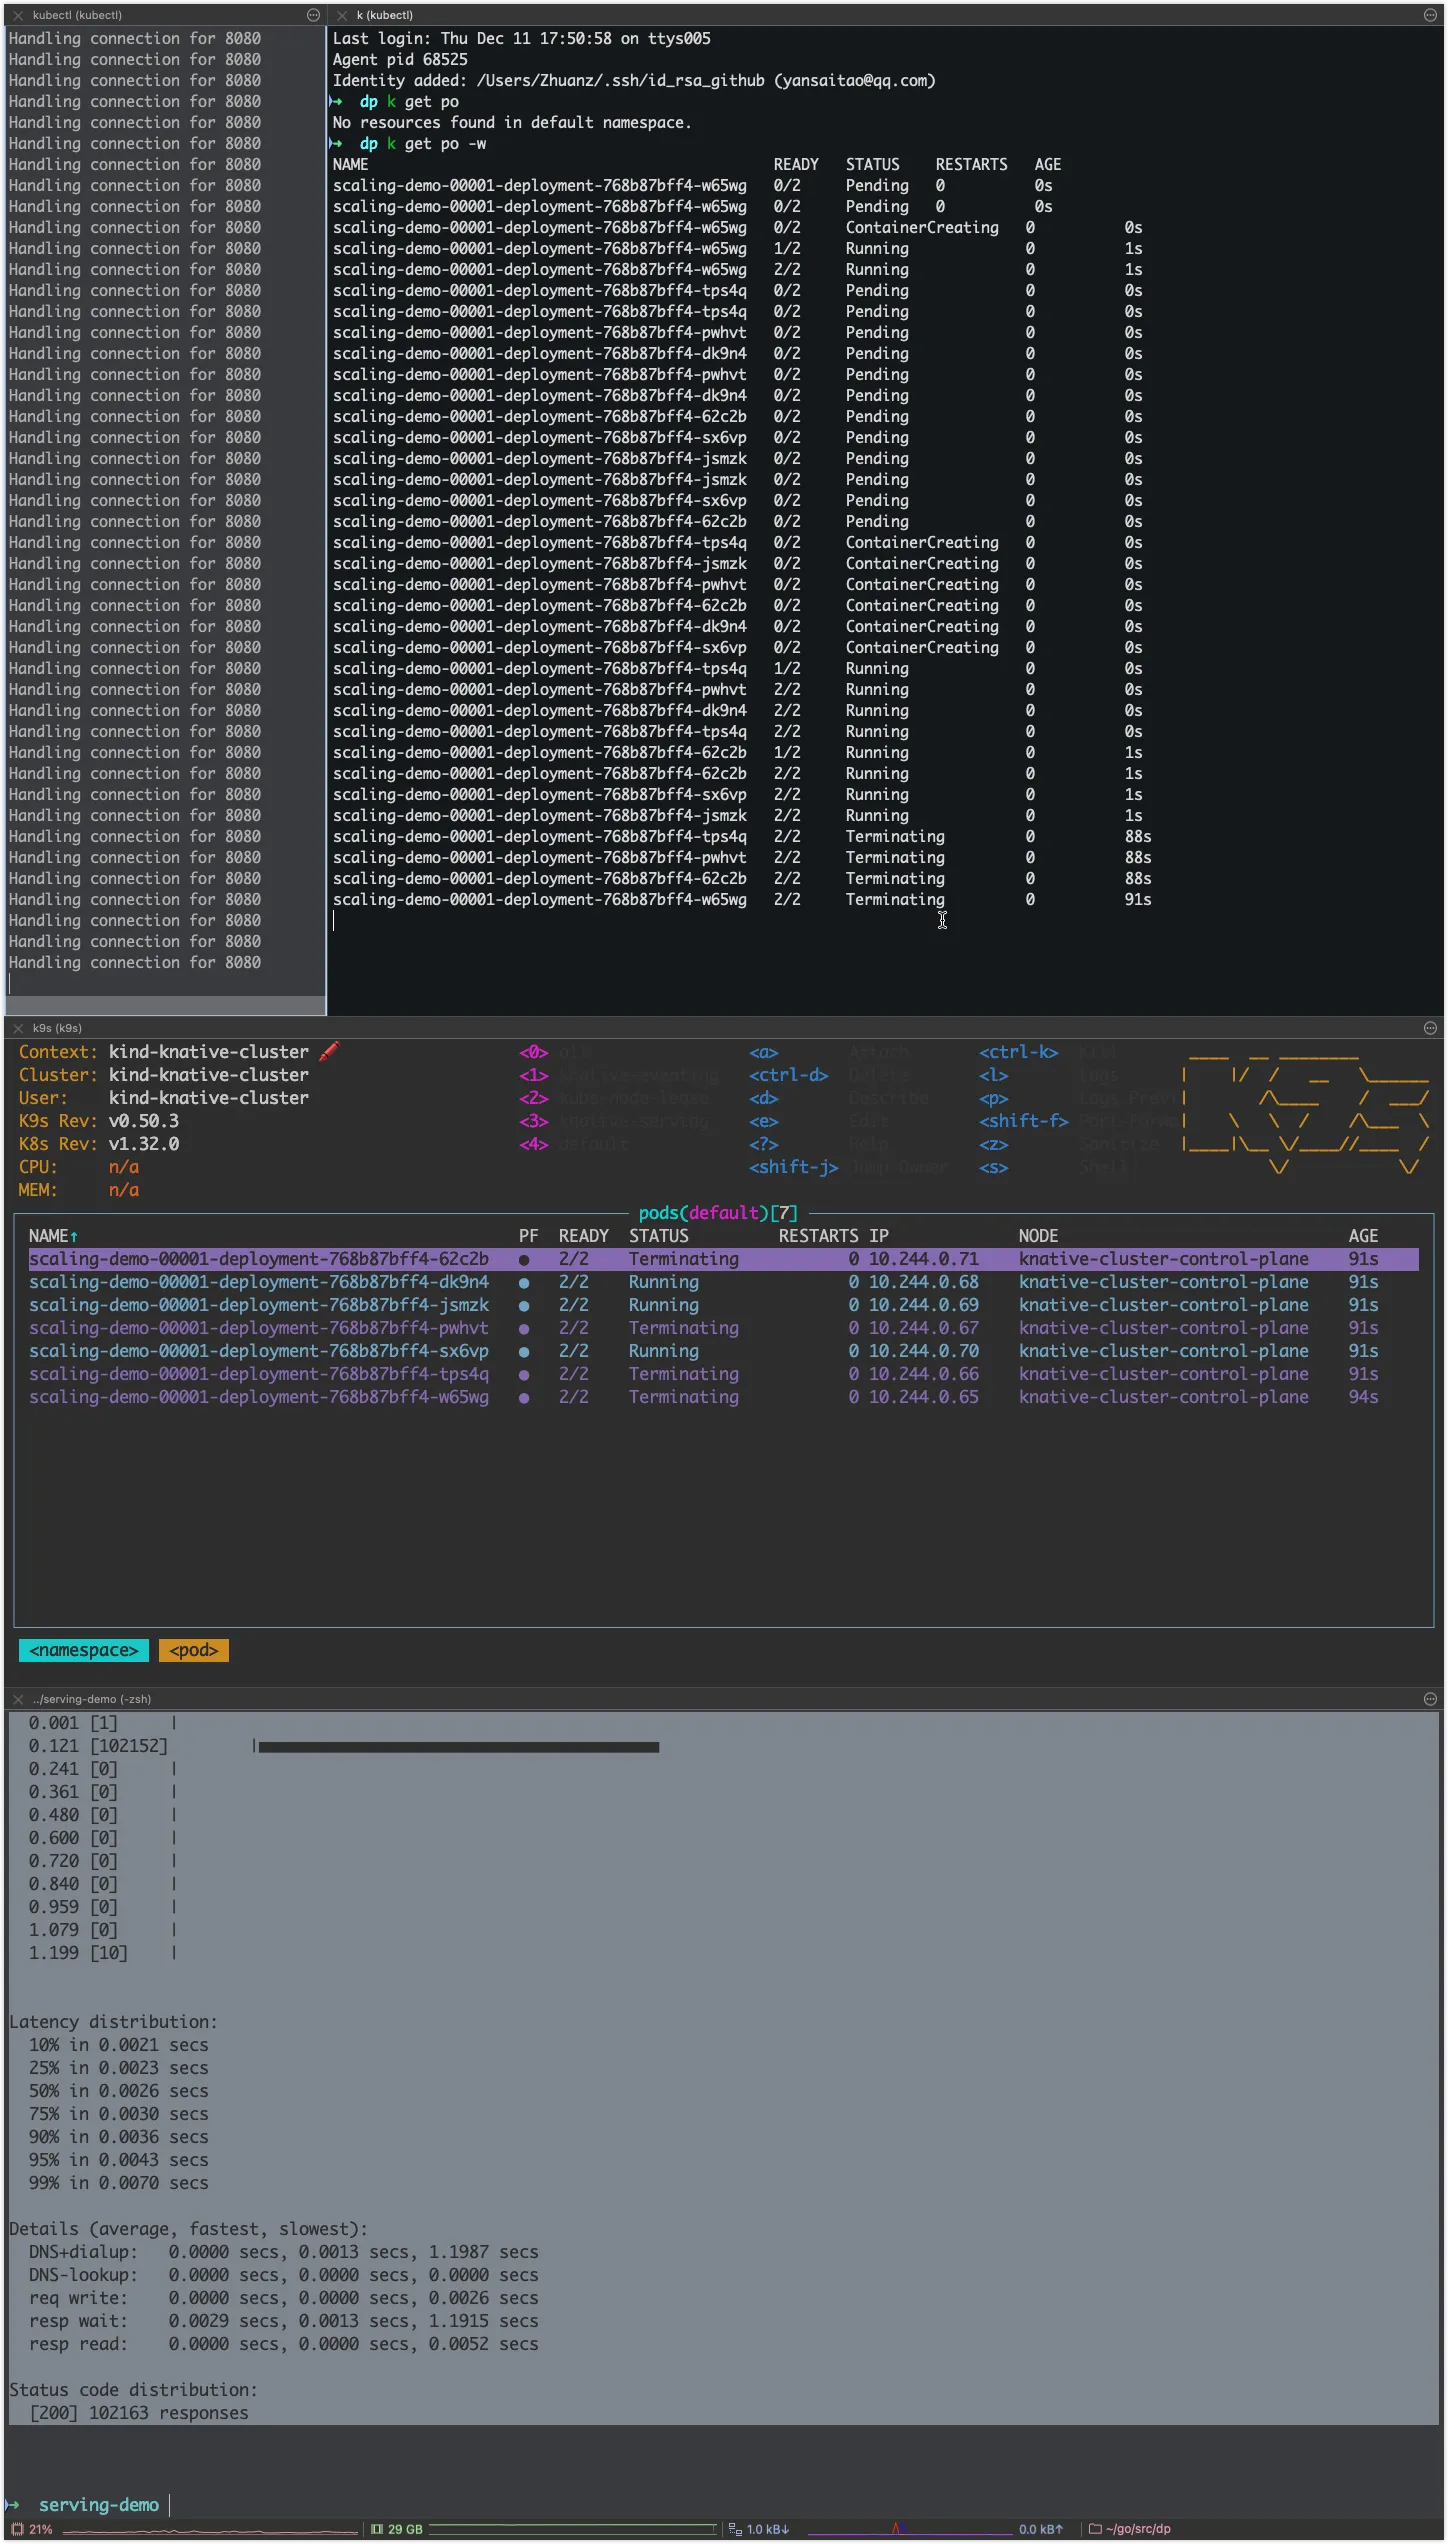
压测一下
go install github.com/rakyll/hey@latest看看效果
hey -z 30s -c 10 -host "scaling-demo.default.example.com" http://127.0.0.1:8080

Summary:
  Total:        30.0019 secs
  Slowest:        1.1987 secs
  Fastest:        0.0013 secs
  Average:        0.0029 secs
  Requests/sec:        3405.2225

  Total data:        2043260 bytes
  Size/request:        20 bytes

Response time histogram:
  0.001 [1]        |
  0.121 [102152]        |■■■■■■■■■■■■■■■■■■■■■■■■■■■■■■■■■■■■■■■■
  0.241 [0]        |
  0.361 [0]        |
  0.480 [0]        |
  0.600 [0]        |
  0.720 [0]        |
  0.840 [0]        |
  0.959 [0]        |
  1.079 [0]        |
  1.199 [10]        |


Latency distribution:
  10% in 0.0021 secs
  25% in 0.0023 secs
  50% in 0.0026 secs
  75% in 0.0030 secs
  90% in 0.0036 secs
  95% in 0.0043 secs
  99% in 0.0070 secs

Details (average, fastest, slowest):
  DNS+dialup:        0.0000 secs, 0.0013 secs, 1.1987 secs
  DNS-lookup:        0.0000 secs, 0.0000 secs, 0.0000 secs
  req write:        0.0000 secs, 0.0000 secs, 0.0026 secs
  resp wait:        0.0029 secs, 0.0013 secs, 1.1915 secs
  resp read:        0.0000 secs, 0.0000 secs, 0.0052 secs

Status code distribution:
  [200]        102163 responses
起初流量很大,deployment 的replica慢慢变大,pod数量上涨;流量下降后,降低replica,自动terminate pod